Nearly 1,500 Customers Take Survey
Mason PUD 3 recently completed our first customer survey to hear directly from our community about what matters most. Nearly 1,500 residential customers shared their thoughts, giving us valuable insight into experiences and priorities. We will be sharing some top-level results in the October newsletter, but are giving you some additional insights as staff right now.
Overall, customers gave us an average positive rating of 83.3% across 12 key questions. The highest marks went to quick outage restoration and reliability, while the lowest scores were related to our program and service offerings, and helping customers use less electricity. Even in those areas, PUD 3 rated better than the U.S. average on all 12 categories and came in just below the Washington state average on only one question. Our Customer Service Satisfaction Award will be announced in early November.
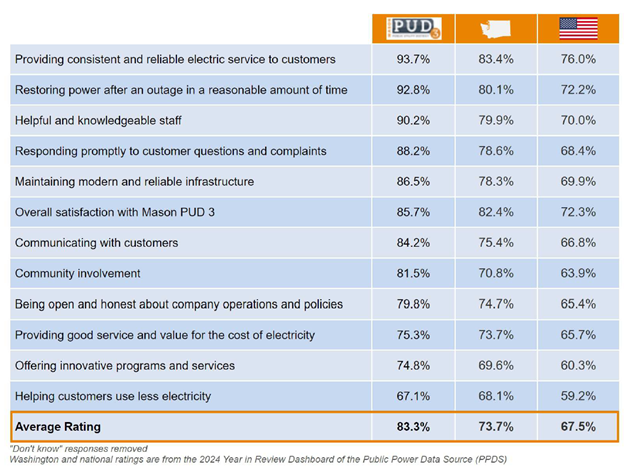
Chart comparing the 12 categories used for overall customer satisfaction, stacked against state and national averages.
When it comes to staying informed, customers said their favorite communication tools are the online outage map, email updates, and the PUD 3 website (pud3.org). The most important topics they want to hear about are outage and power restoration, electricity rates, and utility programs and services. Our future communications will reflect more of this information as requested.
Looking ahead, nearly one-third of customers plan to purchase an electric vehicle, and about one-quarter are considering installing solar panels. That shift in technology and energy use helps guide our planning for the future.
Customers also ranked their most important priorities for PUD 3:
Cost of electricity
Outage management and reliability
Customer service
Financial responsibility
Clean energy
Finally, we were encouraged to see strong support for fiber broadband expansion, with 85.6% of customers very or somewhat supportive.
Here are some more results:

Participation and interest in future participation in programs and rebates - we’re going to work on that 1/5 to 1/4 who “don’t know” about the programs.
Awareness of Solar Net Metering program:
Very aware: 9.1%
Somewhat aware: 20.5%
Not very aware: 20.8%
Not aware at all: 41.1%
Don’t know: 8.4%
Barriers to EV adoption:
Limited range: 44.9%
Higher initial cost to purchase: 42.8%
Low availability of recharge stations: 34.9%
Long charge time: 26.6%
Reliability: 19.7%
I don’t know enough about EVs: 18.0%
Low availability of electric vehicle options: 12.1%
Speed/acceleration of vehicle: 6.3%
Other: 16.0% (152 open-ended comments taken)
None of the above: 14.7%
Timeline for solar:
Within the next six months: 0.5%
Within the next year: 1.5%
Within the next five years: 10.1%
Beyond the next five years: 11.3%
Never: 31.5%
I am not able to install solar panels: 18.7%
Don’t know: 26.4%
Support/opposition for increasing renewables if it increases bill:
Strongly support: 10.3%
Somewhat support: 22.2%
Somewhat oppose: 15.9%
Strongly oppose: 35.4%
Don’t know: 16.2%
Amount $ willing to spend on renewables:
$0 per month: 20.1%
$1-$5: 22.1%
$5-$10: 19.2%
$10-$15: 9.7%
$15-$20: 6.0%
$20+: 3.7%
Don’t know/unsure: 19.2%
Importance of solar/battery storage system at community facility:
Very important: 29.1%
Somewhat important 36.4%
Somewhat unimportant: 8.0%
Not important at all: 12.4%
Don’t know/unsure: 14.0%
Importance of community ownership of PUD:
Very important: 70.8%
Somewhat important: 19.2%
Somewhat unimportant: 3.0%
Not at all important: 2.6%
Don’t know/unsure: 4.4%
Questions? Reach out to Sheila or your supervisor about how these results could shape some of our future planning.